
Prometheus Agent
The Prometheus Agent is a specialized component that enables intelligent interaction with Prometheus monitoring systems, providing natural language querying and advanced metric analysis capabilities.
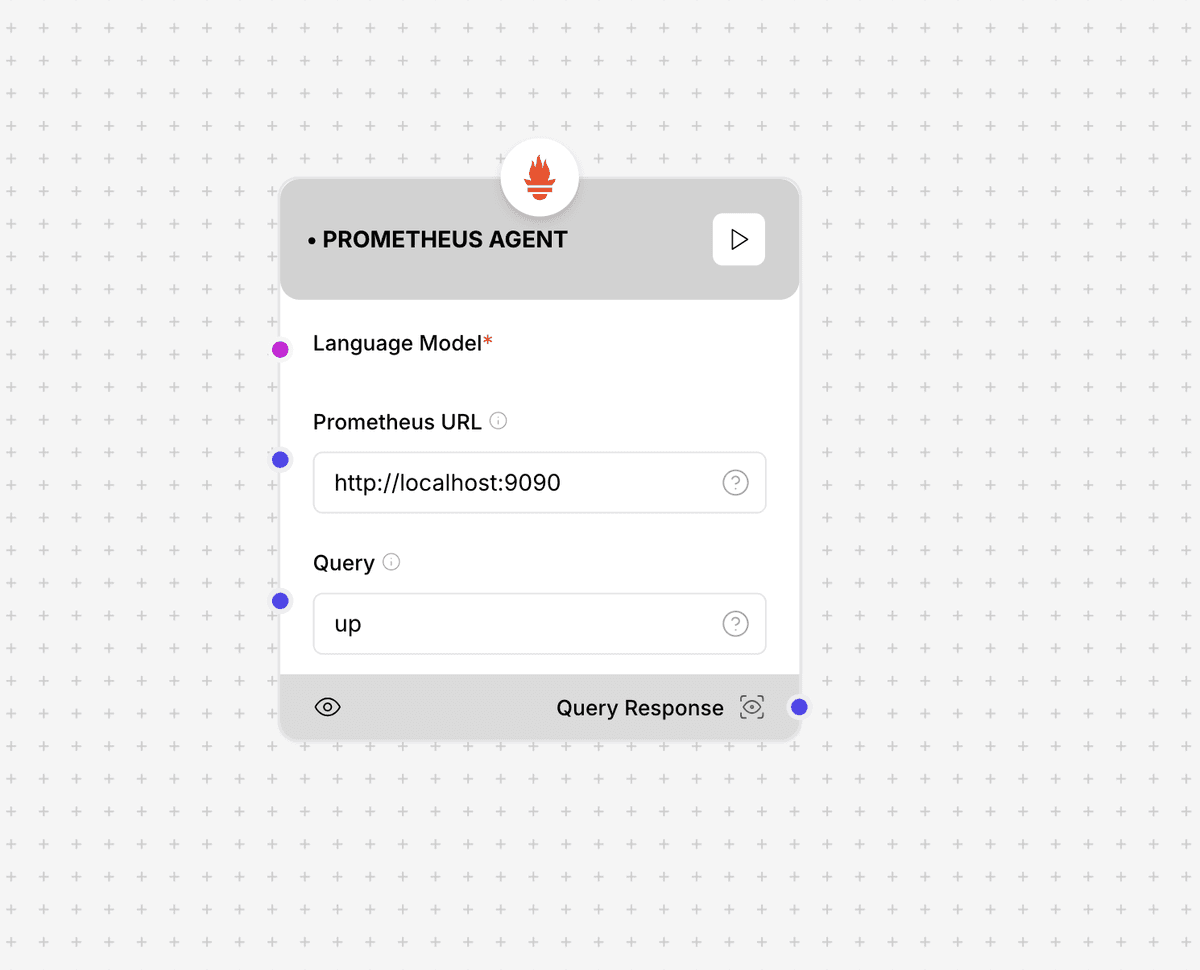
Prometheus Agent interface and configuration options
Configuration Parameters
Required Parameters
- Language Model: The AI model for processing
- Endpoint: Prometheus server URL
- Authentication: Authentication credentials
- Query Type: Type of metric query
- Time Range: Default time range
Optional Configuration
- Query Options: Query settings
- timeout: Query timeout
- maxPoints: Maximum data points
- step: Query resolution step
- Alerts: Alert configuration
- rules: Alert rules
- channels: Notification channels
- templates: Alert templates
- Analysis: Analysis options
- aggregation: Aggregation methods
- prediction: Prediction settings
- correlation: Correlation analysis
Output Format
{
  "result": {
    "query": {
      "promql": string,
      "parameters": object
    },
    "data": {
      "resultType": string,
      "result": array,
      "stats": object
    },
    "analysis": {
      "summary": string,
      "insights": array,
      "anomalies": array
    }
  }
}
Example Usage
const prometheusAgent = new PrometheusAgent({
  languageModel: "gpt-4",
  endpoint: "http://prometheus.example.com:9090",
  authentication: {
    type: "bearer",
    token: process.env.PROMETHEUS_TOKEN
  },
  queryType: "range",
  timeRange: {
    start: "-1h",
    end: "now"
  },
  queryOptions: {
    timeout: 30,
    maxPoints: 1000,
    step: "15s"
  },
  alerts: {
    rules: [
      {
        name: "HighLatency",
        condition: "http_request_duration_seconds > 1",
        duration: "5m"
      }
    ],
    channels: ["slack", "email"],
    templates: {
      default: "{{ .Alert.Name }}: {{ .Alert.Description }}"
    }
  },
  analysis: {
    aggregation: ["sum", "avg", "max"],
    prediction: {
      enabled: true,
      window: "1h"
    },
    correlation: {
      enabled: true,
      metrics: ["cpu", "memory", "latency"]
    }
  }
});

const result = await prometheusAgent.process({
  input: "Show CPU usage trends for all web servers over the last hour"
});
Additional Resources
Best Practices
- Use appropriate time ranges
- Optimize query resolution
- Configure meaningful alerts
- Monitor query performance
- Implement data retention policies